Geological Materials
As a result of a few undergraduate honours students interested in doing their thesis research on a topic that involves both geology and physics, I became interested in the study of geological samples. In particular, the photo- and cathodoluminescent (light emitting) properties of rocks and fossils. Photoluminescence and cathodoluminescence are the terms used when light is emitted from a material when it is hit with light (photons) and electrons, respectively.

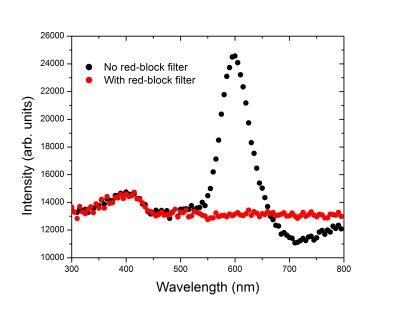
The above two pictures are cathodoluminescence images (full scale about 1 mm) of a brachiopod shell in cross-section that has undergone alteration in the millions of years since it was a living creature. This particular species of brachiopod is still in existance and does not display any cathodoluminesence, hence we know that the shell has been altered which may tell us something of the ancient ocean environment. You may have noticed that the image on the right is much sharper than the one on the left. The reason is that only the blue luminescence was used to form the image on the right, whereas both the blue and orange luminescence was used in the left-hand image. The orange luminescence is long lived, and hence, light from one pixel position will cause a streak into the following pixels thereby blurring the image.

The black curve in the above spectrrum was obtained from the cathodoluminescence signal of the brachiopod and shows two peaks, one in the blue (~400 nm) and the other in the yellow-orange (600 nm). In order to remove the long-lived orange light emission, a red-block filter (only transmits blue light) was placed in the light path before the detector and the filtered signal is shown by the red curve.
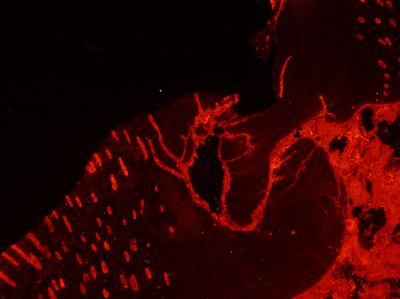
Since the orange light emission peak is much larger than the blue emission peak, the brachipod fossil emits light with an orange colour as shown by the optical cathodoluminescence image (below) of the hinge where the top and bottom shells meet.

In cathodoluminescence, high-energy electrons impact the sample and every possible luminescent pathway is excited. That is, we see all possible colours that can be emitted with no idea of what optical processes or transitions lead to a particular emission peak. In order to help answer the question of the mechanism of luminescence, we built a custom photoemission / excitation spectroscopy apparatus.
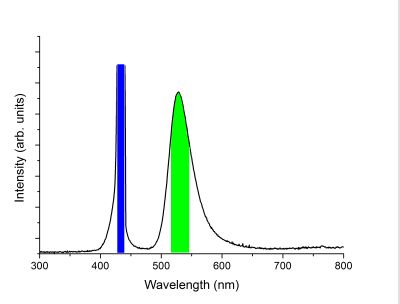
Below is a photoluminescence emission spectrum of the mineral Willemite where the wavelength of the incident light was 420 nm (blue). The Willemite visibly glowed green and this is represented by the peak centred at 522 nm.

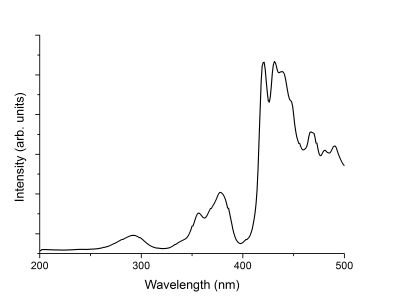
Next, an exitation spectrum of the Willemite was recorded. Since the main emission peak was at 522 nm, a window of a range of wavelengths, as represented by the green bar in the figure above, was set as the detection region. All light within this window was integrated and used as the response of the excitation spectrum. The incident light was then stepped from 200 nm to 500 nm while recording the intensity at the 522 nm window. This lets us know the wavelengths of the optical transitions, as represented as peaks in the curve below, that lead to the green emission. It is observed that there are many optical transitions that all lead to the green glow we observe from luminescing Willemite.

