Acadia Physics Air Quality Monitoring
Exposure to poor air quality can have serious short and long term health consequences. Because air quality can vary over relatively short distances (on the order of a few kilometers) it is important to have access to data from the nearest air quality monitoring site to make an informed decision. In order to provide as much local data as possible, we are endeavoring to distribute air quality measurement modules to schools within the province to increase the availability of accurate air quality reports.
Here is the map showing the air quality from Purple Air air quality sensors. The sensors take air quality measurements that are converted to denote the level of health hazard using the scale below.
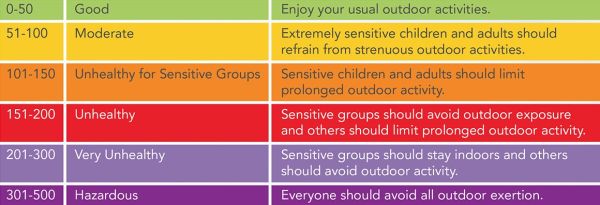
Canadian Air Quality Health Index
The Canadian Air Quality Health Index (AQHI) accounts for a multitude of gaseous particles and particulates that could induce health risks. Like Purple Air, Environment Canada has their own measurement stations throughout the country that report Here, however, the index is a scale from 1-10 rather than 0-500+. Using this scale, the level of hazard associated with outdoor activity is 1-3 for low risk, 4-6 for moderate risk, 7-10 for high risk, and 10+ for very high risk. With low risk air quality, individuals can continue their usual activity without hazard. For AQHI values of 4-6, regular activities can take place however, if coughing or soreness of the throat occurs, consider reducing outdoor activities. During high risk situations, consider refraining from outdoor activities, especially if discomfort arises. Under very high risk conditions, reduce outdoor exposure and refrain from strenuous outdoor activities. Below is a list of particles and particulates the contribute to air pollution, and their induvial health effects.

| Particle | Symbol | Units | Health Effects | Averaging Period |
| Carbon Monoxide | CO | ppb | Replaces Oxygen in blood and can lead to brain damage | 8 h |
| Nitrogen Dioxide | NO2 | ppb | Irritates respiratory system and can damage lungs | 3 h |
| Other Nitrogen Oxides | NOx | ppb | Irritates eyes, throat, and lungs | 1 h |
| Ground Level Ozone | O3 | ppb | Difficulty breathing and airway damage | 3 h |
| Particulates (<10 μm) | PM10 | μg/m3 | Deep lung penetration and degeneration | 24 h |
| Particulates (<2.5 μm) | PM2.5 | μg/m3 | Enters blood stream affecting the heart and lungs | 3 h |
| Sulfur Dioxide | SO2 | ppb | Extreme Irritation to eyes and lungs | 1 h |
All of the above particles can have negative health effects with sufficient concentration, however, in Canada, it is only the Ground Level Ozone (due to its significant contributions to daily air pollution), Particulate Matter less than 2.5 microns (due to the ability to enter the blood stream), and Nitrogen Dioxide (due to its contributions to the creation of Ozone and other particulates), that are accounted for in the AQHI calculation.
Influence of Wildfires on Air Quality
Fires are significant producers of airborne particulate matter. A campfire gives off smoke in its immediate vicinity yielding PM2.5~100-500 μg/m3 within a 10 meter range, so a campfire only emits dangerous levels within its smoke plume.
Wildfires are much larger, causing the PM2.5 to reach dangerous levels of ~500-1000 μg/m3 over hundreds of square kilometres.
During May-June of 2025, a wildfire occurring in northern Manitoba and Saskatchewan produced smoke covering parts of Canada, USA, and even reaching the UK. Below are maps showing the AQHI of central Canada (left) and North America (right), showing the spread of the particulates over a vast range.
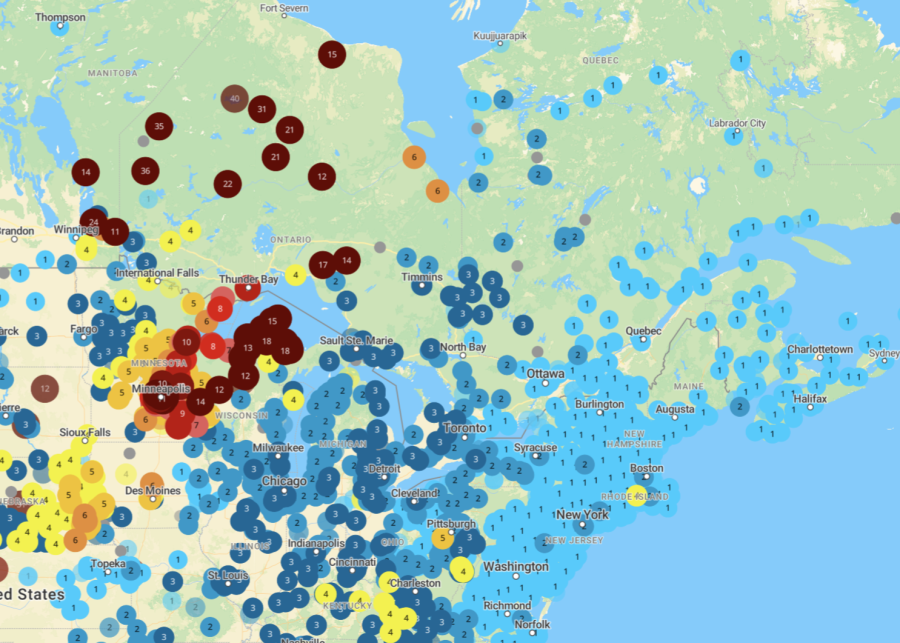
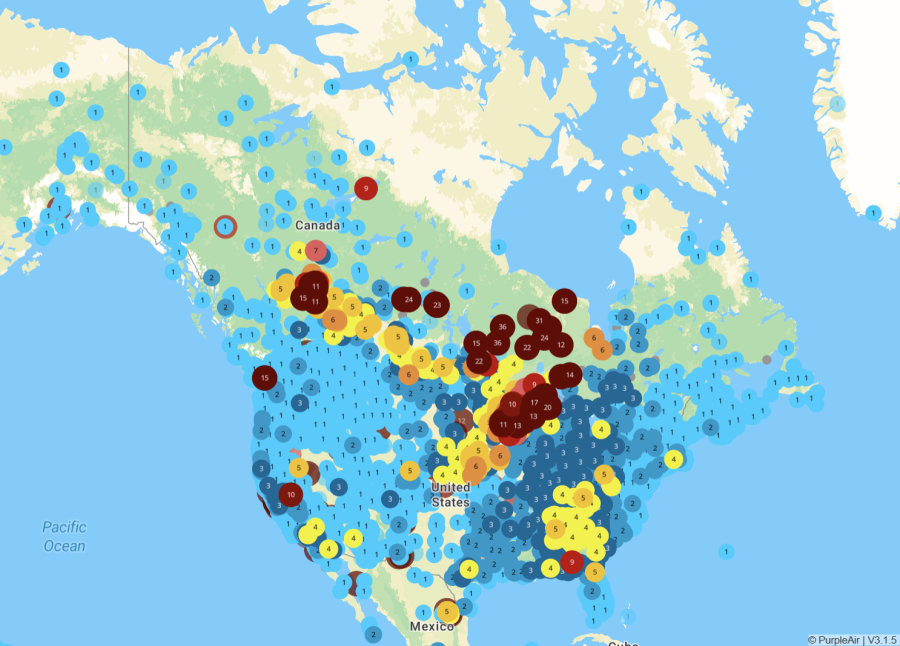
jhjhgjhg
Our Influence
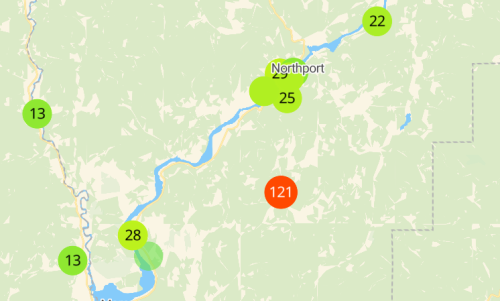
With wild fires becoming increasingly common, the need for accurate measurements of particulate matter in the air is paramount. Environment and Climate Change Canada (ECCC) has over 200 air quality monitoring stations placed around the country. However, as shown in the figure, air quality can vary considerably over relatively short distances. People have reported experiencing negative health consequences, despite checking the nearest air quality monitoring station that was at a significant distance from their community. This has inspired us to ensure access to local air quality data in as many communities as possible in the Annapolis Valley (and hopefully beyond)